Introducing ALEKS QuickTables

ALEKS QuickTables is a Research-Based Online Math Facts Program:
-
Research-based program with individualized assessment and learning
-
Covers 0-12 range of facts for multiplication, division, addition, and subtraction
-
Content correlated to NCTM standards
-
Ongoing practice helps students learn and recall facts
-
Interactive games provide additional review and built-in rewards
-
Online access - PC and Mac Compatible
-
Fully Bilingual - English and Spanish
QuickTables is complimentary with every ALEKS account.
Interactive Tutorial
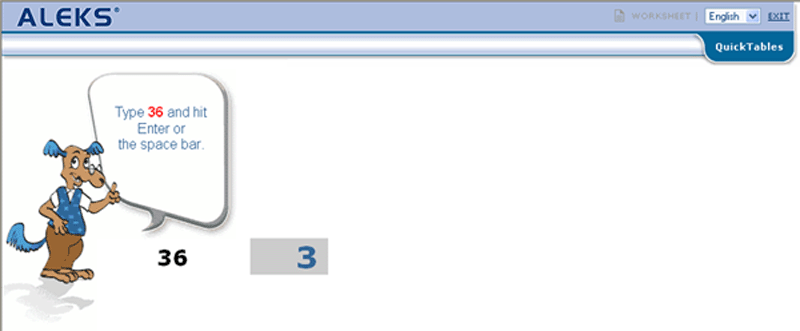
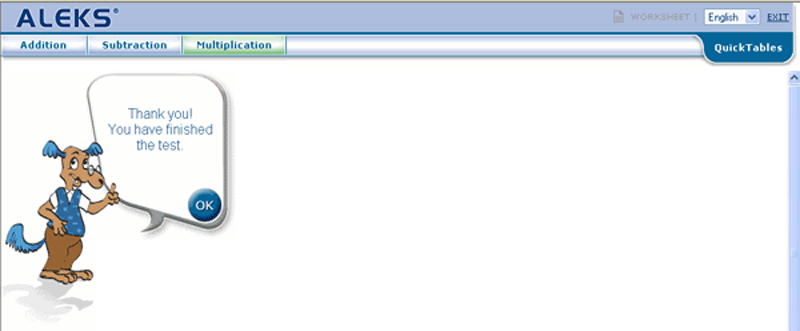
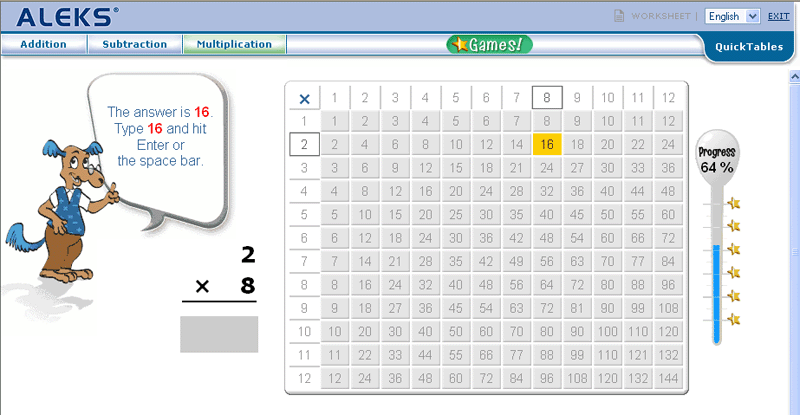
After registration, the student practices entering numbers and then takes a brief timed test on entering numbers.
The student will then choose the table they will work on.
Assessment
After the student achieves a basic familiarity with entering numbers, ALEKS administers an interactive assessment for the chosen table.
Table
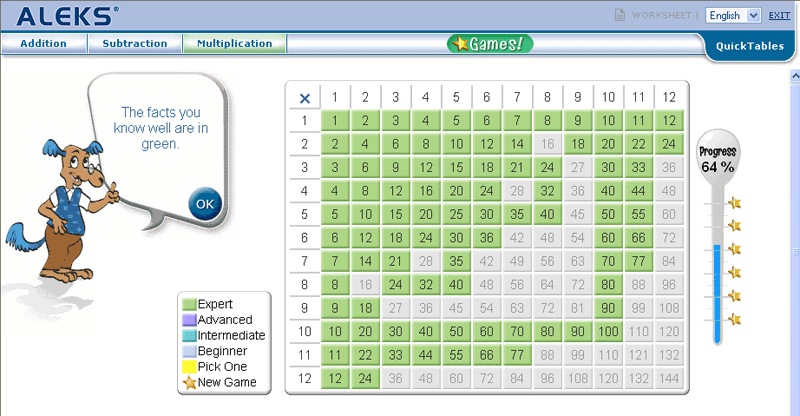
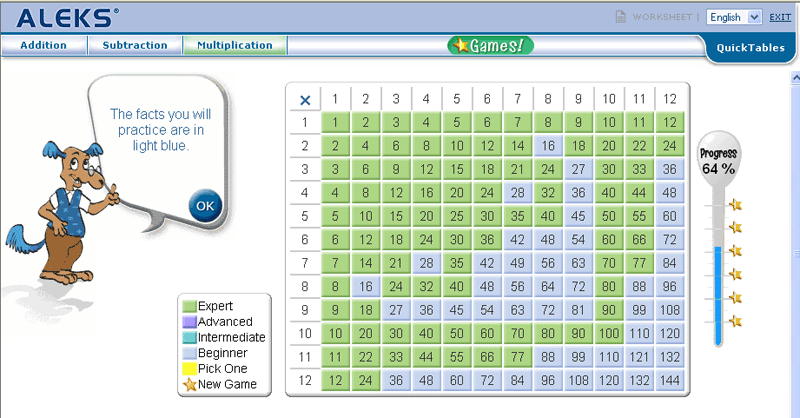
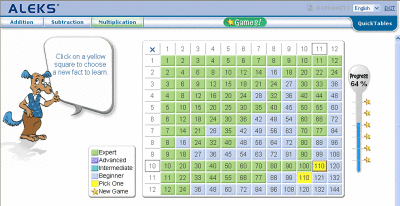
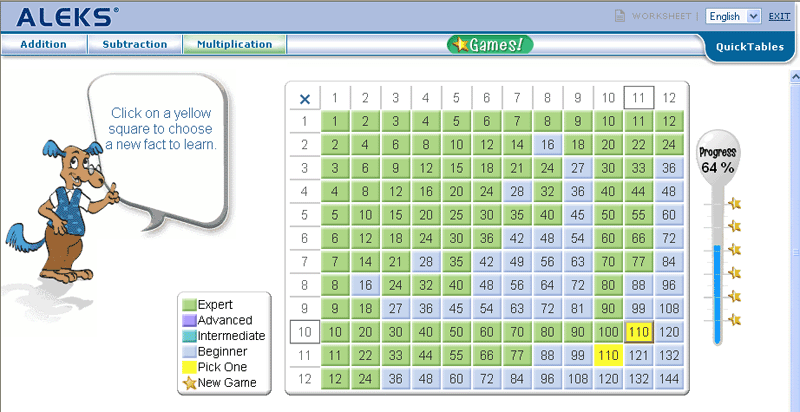
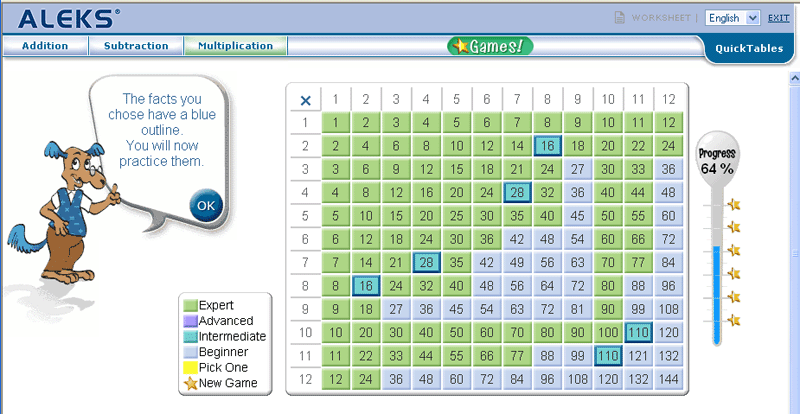
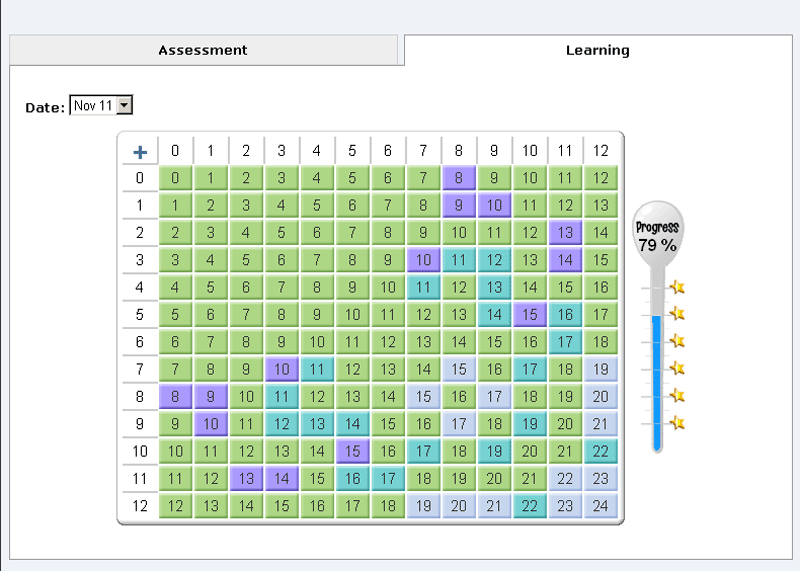
Following the initial assessment, the student receives a color-keyed table. In the table, colors correspond to a level of mastery for each math fact. In the below example, the student is an Expert on the green facts but only a Beginner on the blue facts.
Learning Mode
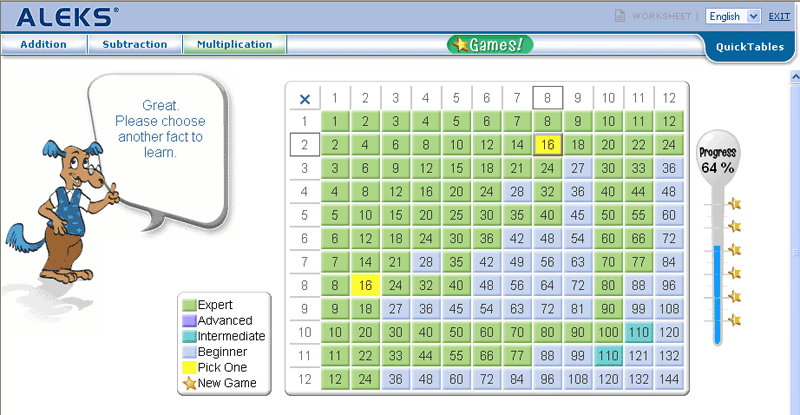
The
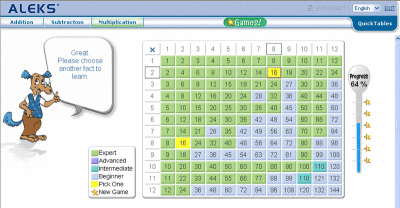
yellow facts are facts that the student can choose to work on by clicking on the
fact.
Immediate Feedback
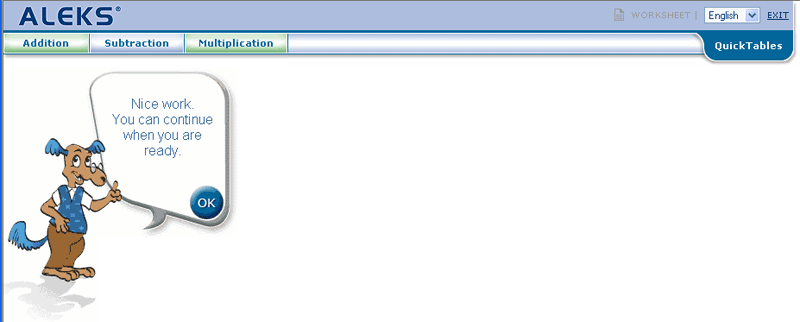
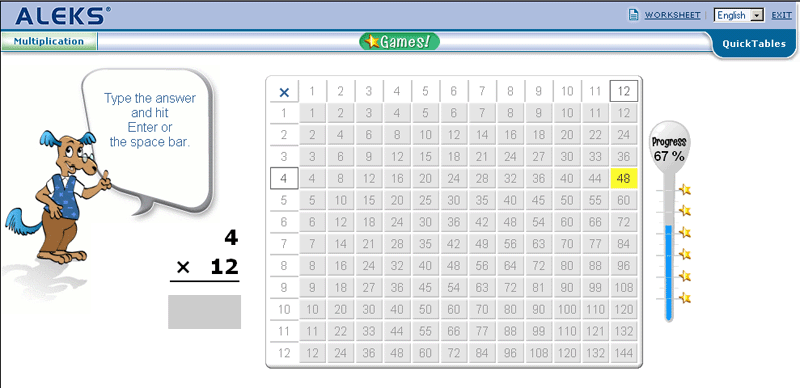
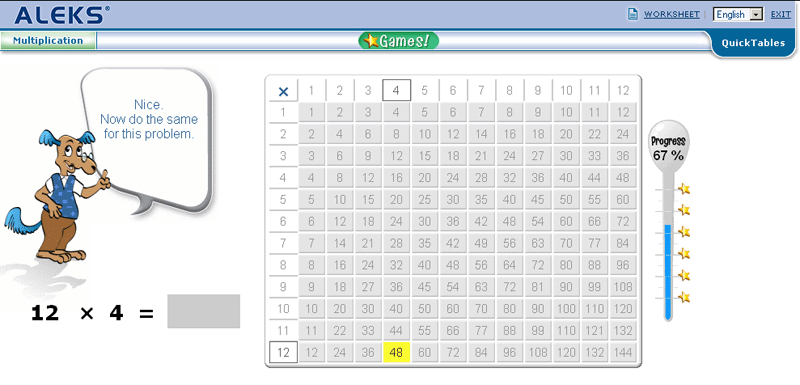
The student receives immediate feedback when she enters her response, as well as help with the correct answer if she answers incorrectly.
Review
In ALEKS QuickTables, the memorization of math facts is facilitated by a distributed practice mechanism that closely adapts to the individual student. This enables a learning sequence that carefully mixes new and partially mastered problems, gradually moving the learned facts from short-term memory to long-term memory.
Worksheet
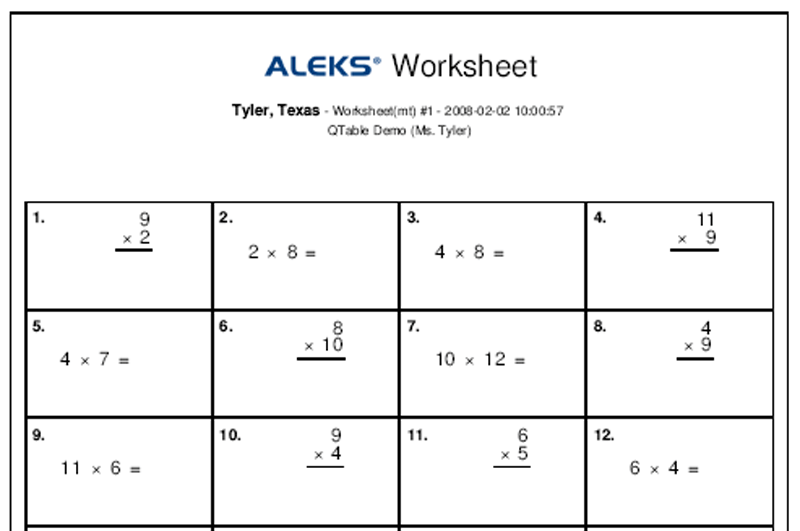
Students have the ability to print 40-question worksheets for additional practice or review. These worksheets are uniquely generated based on the student's math fact mastery.
Master Account
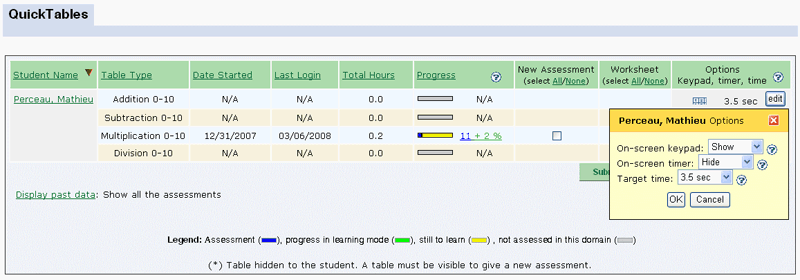
The Master Account allows students to monitor their progress and adjust program settings.
Reporting
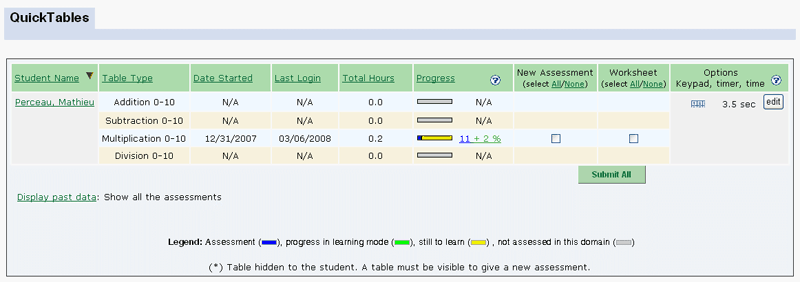
ALEKS provides students with a wealth of information on their progress, including last login, duration of answer timer, individual performance, and much more. Bar graphs allow students to quickly gauge their performance at the time their last assessment (blue), progress in Learning Mode (green), and the material not yet mastered (yellow).
Student Progress
Students can choose to have access to an onscreen keypad and timer, as well as customize time settings.
Student Report
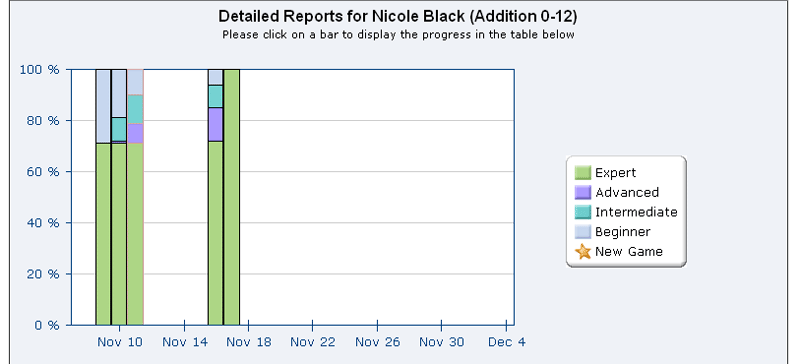
Students can also access a comprehensive progress report. This report will show the student's current bar graph for each table. They can also view a table for any specific date, as well as a vertical bar graph report showing their progress over time.
Creating New Tables
Students can add new tables using the Master Account.
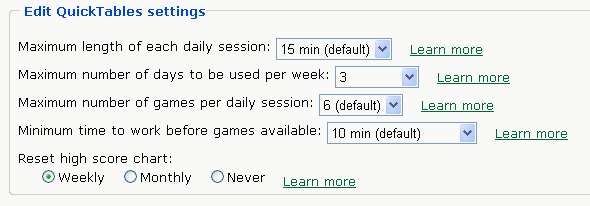
Students can also edit existing tables by adjusting the default program settings.
|


